
Graph based Approach to Process Technical Analysis Reports
A novel graph modeling approach to derive insight from technical analysis reports


Introduction
Over the past several months, I have had the incredible privilege of joining the Eveince Research Internship Program in Summer 2021 as a Data Science Researcher. Eveince Research Team is formed to conduct cutting-edge research on Machine Learning and Data Mining for Financial Products. This program, in particular, was centered around NLP and Information Extraction with the aim of developing a platform to automatically derive and aggregate insights from the Cryptocurrency Technical Analysis Reports. I was mainly focusing on the problem modeling part, in which we have developed a text graph construction method and a Graph Neural Network-based model for document classification.
In the previous part, we explored the Technical Report Analysis problem and how we have formulated it. In this blog post, our graph-based approach to classifying documents is described.
Problem Modeling
We are dealing with text data in this problem, and the way we represent natural language has a fundamental influence on the way we process and understand it. A bag of tokens, a sequence of tokens, and a graph are generally three different ways that are used by the NLP community. To exploit richer relations among documents, we take the graph representation approach and construct a graph structure based on the given dataset. This approach, moreover, allows us to model our desired entities such as topics and price patterns, that are related to our specific problem, as part of the graph structure. As a result, we can incorporate external knowledge bases, and build richer relationships among different elements.
Once the documents in our corpus are transformed into the form of graph structure, we can view the document classification task as a node classification or link prediction problem. In the former, we predict the class of each document node, while in the latter the link between a document and position node is predicted. The overview of the proposed model is illustrated in the figure below. In the following, we provide detailed information about how our graph structure is constructed.

Graph Construction
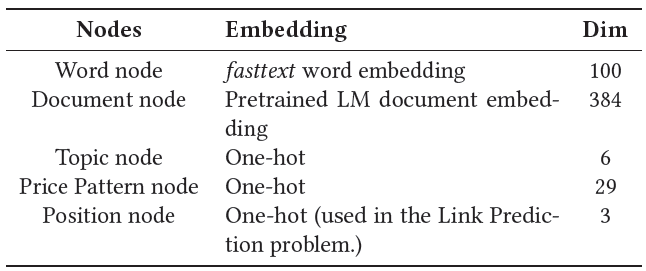
We consider words, documents, topics, price patterns, and document positions as different types of nodes in our graph structure with different initial embeddings. Documents and words are basic elements of corpus graph representation and other types of nodes are added to enrich the graph structure. Document position nodes are labels of the documents that are only used in the link prediction problem.
Technical analysts have long used standard price patterns to examine and forecast market movements, and therefore we introduce the price pattern node type that is connected to the documents containing that pattern. In addition, we connect patterns that have known implications in the technical analysis literature to the position nodes. Moreover, to utilize high-level semantic information of documents, we connect a topic node 𝑡, which resulted from the topic modeling step, to document, word, and price pattern nodes.
An illustration of sample graph representation is shown below in which a highlighted document connects to its own words, price pattern, and topic.

Words and documents connect based on word occurrence in documents so that the weight of the edges is defined by the term frequency-inverse document frequency measure (TF-IDF). Point-wise mutual information (PMI) is also calculated between every two words within a fixed-size sliding window to connect words with positive PMI values together. Here, we summarize the kinds of relations between different node types.

Graph Modeling
Graph Neural Network (GNN), as a powerful tool for processing graph-based structures, derives informative representations for each node through transforming and aggregating neighbors' information such that we can perform downstream tasks on the updated embeddings. To provide initial embeddings for words and documents, we used fasttext word embedding and a pre-trained language model document embedding respectively. Topics, price patterns, and document positions are initially embedded in the form of one-hot vectors.
Additionally, we can use Deep Graph Infomax (DGI) to learn node representations in an unsupervised manner. DGI’s core idea is learning to distinguish between the original graph and the corrupted one that derives from a corruption procedure e.g., randomly shuffling the node features. The model consists of an encoder that takes an input graph and computes an embedding vector for each node. The weights of the encoder are trained according to the distinguishing step such that DGI learns to discriminate between nodes that have sensible connections and nodes that have unexpected connections. After training, the encoder can be used independently to compute node embedding vectors directly. Due to the heterogeneity, we separately run the same algorithm with the same parameters for each node type.
Standard forms of GNNs such as GCN, GraphSAGE, GAT, etc. are mostly designed for homogeneous graphs, and therefore cannot be fitted to our structure. To address this issue, we extended the GraphSAGE model to be able to aggregate feature vectors from different node types in heterogeneous graphs. Our work is inspired by the HinSAGE model which is introduced by the Stellargraph library.
GraphSAGE is a framework for inductive representation learning on large graphs and is capable of learning an embedding function that generalizes to unseen nodes, without requiring a re-training procedure. The key idea of this approach is training a set of aggregator functions that learn to aggregate feature information from a node’s neighborhood. In particular, as shown in the HinSAGE algorithm, each node iteratively aggregates the representations of the nodes in its one-hop neighborhood via edges of type 𝑟, and concatenates its current representation with the aggregated neighborhood vector. There are separate neighborhood weight matrices for each relation between two node types, as well as separate self-feature matrices for every node type. HinSAGE finally passes the concatenated vector through a neural network layer with non-linear activation function 𝜎 to update the node embedding.

Results
The following table compares the final results of all the models developed in this study and our baselines. Link prediction using DGI and Hinsage models have the highest F1-score among the others and outperformed the baselines. By modeling the classification problem in the form of edge probability estimation, we are required to introduce a position node, and connect each tagged document to its corresponding position. We also connect some of the price patterns to their implications (long or short), which brings new kinds of information to this setting. Both modifications result in a more informative and richer graph structure that is essential for GNN models to learn better representations. Therefore, link prediction methods, in general, outperform node classification tasks.

To examine the effectiveness of each group of nodes in the graph, experiments were done using different combinations of nodes. The highest scoring result belongs to the link prediction task using the HinSAGE model with word, document, topic, and position nodes. Using DGI and HinSAGE in the link prediction achieves almost the same result, however, it can be seen that DGI improves the performance of node classification in many cases.

The following illustrations demonstrate the output embedding of documents projected to 2 dimensions in two different settings: embeddings derived from topic distributions and the embedding learned through HinSAGE node classification. The blue, green, and red dots correspond to the documents with Long, Short, and Education labels respectively.

Contributions
In general, we can summarize the main contributions of our research as follows:
Proposing a novel heterogeneous graph construction method for representing technical analysis documents, and a GNN model for document classification.
Conducting experiments showing that our method outperforms several state-of-the-art document classification baselines.
Introducing the “Stock Market Technical Analysis Reports Classification” task, which to our knowledge is a novel work in related domains.
Presenting a dataset of technical analysis reports in the cryptocurrency market to enable further research in this area.
 | A guest post by
|