
Risk Profiling: Usage and Weaknesses

Introduction
When you work in the financial industry, especially as an investor or wealth manager in risky markets, you are always confronted with uncertainty due to unpredictable market movements. There are myriad factors that affect the price direction and the fluctuations inject risk into your trading strategies. While you can make a big profit in less than one hour, you are likely to lose them even faster in volatile markets. Therefore, fund managers should aware the investors of the hidden risks and plan an appropriate investment strategy according to their risk tolerance.
All hedge funds have various solutions and techniques to cope with the risky market and hedge their money or assets against negative risks. Because of the wide range of risk handler techniques, numerous investment strategies can be stemmed from different risk considerations and are dedicated to different investors based on their risk profiles. However, risk assessment is a complex discipline, not fully understood by its practitioners. Risk assessors must be aware of the strengths and limitations of their methods as the results can have a significant impact.
Risk profiling is the procedure that practitioners evaluate and measure the investor’s risk tolerance during the market fluctuation. The risk profiling techniques open the door and help the advisors to create a customized portfolio with a specific risk characteristic that is completely matched with the investor’s requirements.
Investor risk profiling is at the heart of private fund management. In theory, without proper knowledge of the investor’s aims, time horizon, liquidity needs, and risk aversion, it is impossible to recommend suitable investments or build efficient long-term investment strategies for that investor. There are several instituted suitability rules for every financial market to ensure that all the investors are sold the only products that are suitable for them.
In this blog post, I want to talk about the current risk-profiling practice for assessing the investor’s risk capacity and risk aversion and my focus will be on the questionnaire's weaknesses. These days, many hedge funds use questionnaires to elicit the investor’s risk appetite, however, the current standard process of risk profiling through questionnaires is found to be highly unreliable and explains less than 15% of the variation in risky assets between investors. However, new studies demonstrate that several different factors can provide more accurate and reliable insight into the risk profiles of investors. For instance, the experiences of the investors, the previous financial decisions that they have made in the past, and the influence of family, friends, and advisers are some main factors that determine the risk habits. Based on these facts, if we want to measure risk tolerance, we should define it in the first step.
Risk Tolerance is referred to as enduring the hardship or pain of fluctuations in price while holding assets in hopes of gains in the long run. Several factors have an impact on risk tolerance evaluation. Measuring the investor’s risk tolerance would be very tough if we could not determine the effective factors in risk profiling techniques. Therefore, to make it easier to decompose the risk tolerance elements, we can divide these factors into two groups, Risk capacity, and Risk aversion.
The Risk capacity applies to the objective ability of an investor to take on financial risk. Capacity depends on objective economic circumstances, such as the investment horizon, liquidity needs, income, and wealth. The distinguishing feature of risk capacity is that it is immune to psychological distortion or subjective perception.
Risk aversion, however, is the combination of psychological traits and emotional responses that determine the investor’s willingness to take on financial risk and the degree of emotional pain the investor experiences when confronted with financial loss. Subjective perception, especially subjective probability, which is the investor’s probability evaluation of uncertain events, is the principal component of measuring risk aversion. This perception is the main factor that demonstrates to what degree a given investor deviates from idealized rational behavior. We will discuss subjective probability perception in another blog post.
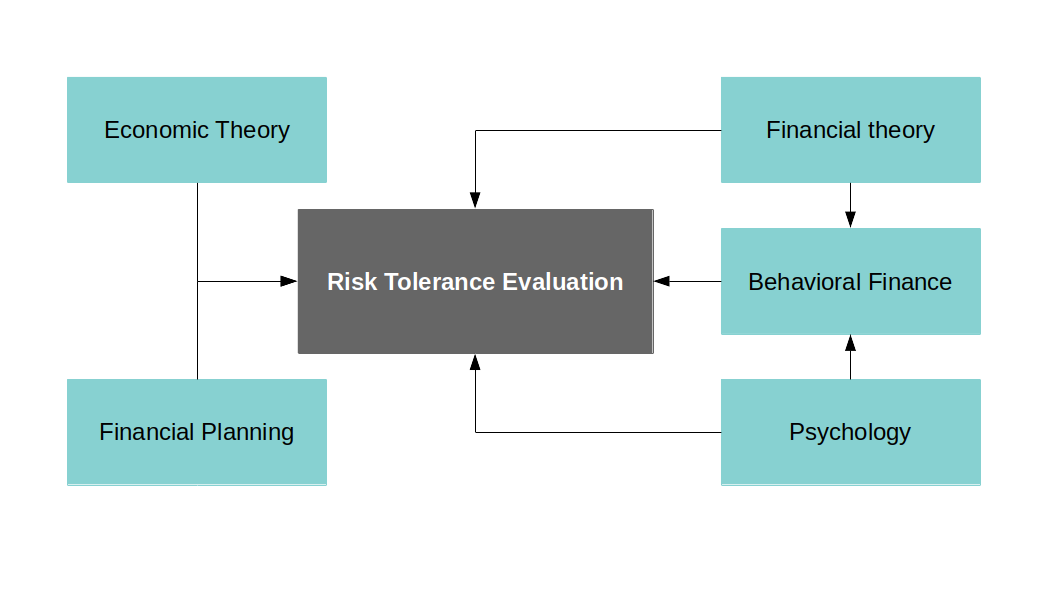
It is obvious that myriad various factors have an impact on the investor’s risk tolerance, which includes many different disciplines. The multidisciplinary nature and the relations between the disciplines are shown in Figure 1.
In the next section, At first, I define the current risk-profiling process and then concentrate on its weaknesses and drawbacks.
Current Practice
The typical investor risk-profiling process is shown in Figure 2. The task usually begins with a definition and discussion of the investor’s situation and the goal(s) that are to be achieved by the investments or portfolio. Then the investor should fill out the questionnaire which will be evaluated to score the investor’s risk tolerance. After that, an appropriate investment strategy will be chosen and assets will be allocated according to the score.
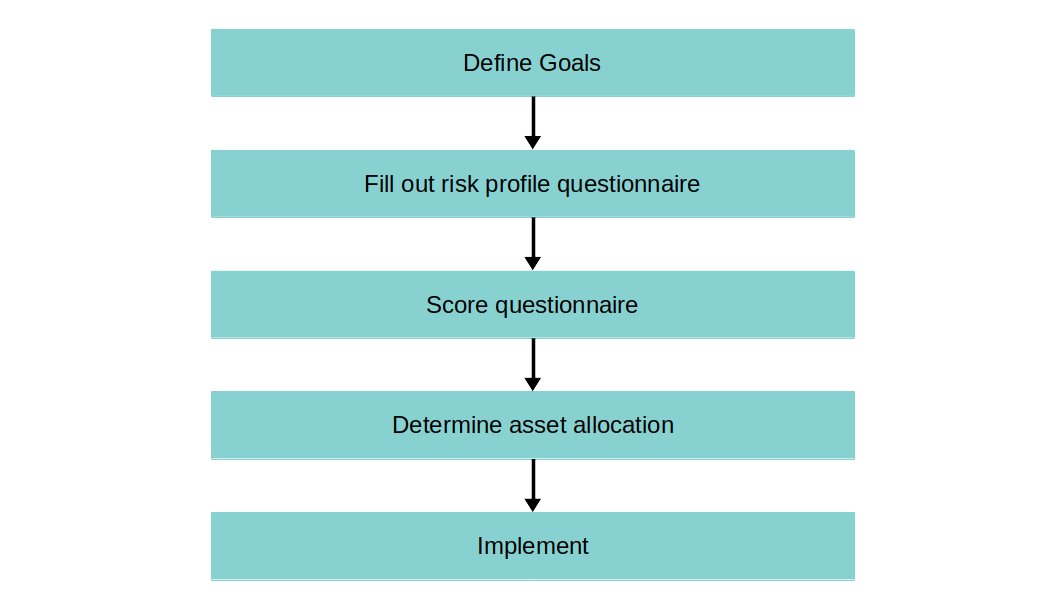
Define Goals
The first step is defining the investment goals, and serious issues arise at this point: Investors may have multiple goals, they may never have considered or articulated their objectives in this way, and they are not necessarily able to capture goals in terms of quantity or time. A common multiple-goal situation is posed by an investor who wants to save for retirement, which she expects in 10 years, while also wanting to save for a down payment on a new house. What financial investment will achieve this goal may be hard to define.
Fill out Questionnaire
If we assume for the moment that the goals of the investor can be adequately defined, the process moves to fill out a questionnaire intended to quantify and document the risk aversion and risk capacity of the investor. At this stage, problems arise again: In theory, to provide meaningful and reliable results, questionnaires need to be properly validated and tested. Validation and testing, however, are seldom done.
Rice (2005) analyzed 131 questionnaires from investment firms and advisers in the United States, and his findings are troubling, to say the least. The number of questions used in the questionnaires ranged from 1 to 49. Probably the most troublesome finding is that 11% of the questionnaires he analyzed explicitly asked the investor to select a specific risk profile or portfolio. One has to wonder what use a questionnaire is if it asks the investor to provide the result of the risk-profiling analysis.
Even for more sophisticated questionnaires, however, the design is hardly robust. Although 65% of questionnaires had at least one question about the investor’s time horizon, 35% did not ask about the time horizon at all. Some 70% of questionnaires asked about the investor’s anticipated behavior in various market circumstances, but the treatment was superficial and never related to the investor’s financial situation. Yet, putting a scenario into a context relevant to the individual investor is important; a financial loss of $10,000 might be devastating to a student but not relevant to a millionaire. To truly assess the emotional reaction that a financial loss might trigger, the size of the loss has to be meaningful to the investor and to evoke an emotional response, it has to be made relevant.
The influence of framing on the outcome of financial decisions has long been established. Thus, hypothetical scenarios in questionnaires should be framed in meaningful ways for an individual investor something hard to accomplish in paper-based questionnaires. To demonstrate the impact of framing on the outcome of risk-profiling questionnaires, 489 individuals through Amazon’s MTurk service are recruited. Each individual was randomly assigned to one of three simple risk questionnaires for which they had to answer a few personal questions—age, gender, income, and education—as well as four scenario questions of the following form:
Version 1: Assume you invest half your savings in stock A. After one month, the investment has declined by 10%. What do you do? Buy some more, do nothing, or sell?
Version 2: Assume you invest $100 into stock A. After one month, the investment has declined by $10. What do you do? Buy some more, do nothing, or sell?
Version 3: Assume you invest $10 million into stock A. After one month, the investment has declined by $1 million. What do you do? Buy some more, do nothing, or sell?
Questions were asked for a decline of 10%, 30%, and 50% as well as an increase of 10% in the stock price. Figure 3 shows the percentage of respondents who chose to sell their stock holdings depending on the amount lost or gained. The differences between the three versions of the questionnaire are statistically significant.

When differences in age, gender, income, and education of the respondents were taken into account, the $1 million frame (Version 3 in the experiment) led to a significant increase in the propensity to sell and a decrease in the propensity to buy some more. The differences between the $100 frame (Version 2) and the percentage frame (Version 1) became no longer statistically significant when the differences in age, income, and so on, of the respondents, were taken into account. For all the respondents in the experiment, a loss or gain of $1 million was The current practice of risking a vast sum of money whereas $100 was typically a small amount.
When dealing with large stakes—even if it is just on paper—the emotional reaction to losses is bigger than when dealing with small sums or abstract sums, such as percentage losses. This increased emotional reaction increases loss aversion. The percentage of respondents choosing to sell in the $1 million frame is typically about one-third higher than in the percentage frame. Unfortunately, the questionnaires analyzed by Rice (2005) all framed scenarios in terms of percentages or small money amounts. The current practice of risk questionnaires is thus likely underestimating the risk aversion of investors. When faced with a generic paper questionnaire, we might all be risk-loving investors, but when the next financial crisis hits, actual behavior might be very different from what we said we would do when answering a questionnaire.
Score the Questionnaire
Once the questionnaire has been completed by the investor, the answers are then typically scored by the adviser/investment firm and matched with a specific asset allocation. In his survey of business practices, Rice (2005) found that scoring and mapping are done in highly subjective ways. Scoring was generally done on an equal-weight basis, even though some questions might have been more important in determining the risk profile than others. Similarly, the confidence an investor had in specific answers was ignored in every instance, even though the abstract nature of the questions might lead to large variations in confidence levels. Finally, the determination of the resulting asset allocation seems to be typically done in such a way as to benefit the investment firm rather than the investor.
The influence of the adviser is greater than most investors (or regulators, for that matter) realize, as shown by Foerster, Linnainmaa, Melzer, and Previtero (2014) in an analysis of more than 180,000 Canadian brokerage accounts. They found that standard regressions that took into account risk tolerance (as indicated by answers to simple hypothetical questions), investor time horizon, financial knowledge, income, net worth, age, gender, and occupation could explain only 13.1% of the variation in the share of risky assets in investor portfolios. When the influence of the adviser was taken into account, the share of variation in risky assets that could be explained rose to 31.6%. In other words, the adviser turned out to be a more influential factor in the makeup of investor portfolios than the factors typically evaluated in a risk-profiling questionnaire. Similar results were obtained for the home bias in investor portfolios.
Determine Assets Allocation
The final step is asset allocation based on the investor’s risk profile. This step will be very tricky because of errors propagated from the first step to the last one. If you cannot determine the risk profile accurately, you will definitely not be able to allocate the investor’s assets into suitable strategies. It will cause to derail the investment process in the long-term and leads to numerous hazards.
In summary, increasing evidence indicates that the current practice of using questionnaires to determine investor risk profiles is of limited reliability. The variation in risky assets in investor portfolios explained by variables such as age, gender, time horizon, and risk aversion is in the range of 5% to 15%, leaving the majority of the variation unexplained.
More accurate risk-profiling factors
If the questions in the widely used approach of questionnaires do not explain the majority of variation in risky assets between investor portfolios, what factors do explain these differences? And can we use these factors to build more accurate risk profiles than questionnaires provide?
A growing body of research shows that the biggest impact on our risk preferences comes from our experiences and the environment we interact with. The factors influencing investor risk profiles can be placed in three categories:
Our genetic predisposition to take on financial risks.
The people we interact with and their influence on our views.
The circumstances we experience in our lifetimes—in particular, during the period psychologists call the formative years.
We will discuss each of these items in the following blog posts.
In summary, practitioners need to be aware of these research findings, but perhaps more crucial is that they be able to identify the combination of traits and biases in each individual. Using generalizations is not going to be helpful. It could do more harm than good.
References
Rice, D.F. 2005. “Variance in Risk Tolerance Measurement—Toward a Uniform Solution.” Ph.D. Thesis, Golden Gate University.
Foerster, S., J.T. Linnainmaa, B.T. Melzer, and A. Previtero. 2014. “Retail Financial Advice: Does One Size Fit All?” NBER Working Paper No. 20712.