


Technical Analysis Reports as a Source of Market Insight
Using NLP to process market analysis reports published online


This post is the first part of a series about the Eveince Research Program. I was part of the Eveince research program in the summer of 2021. Eveince research program is designed to conduct high-tech research and development. We aimed to solve the financial text analysis problem for deriving insights from financial text data and looked at the problem from a different angle than most tools and research in this area. The problem was defined as deriving insights from technical analysis reports written by experts in the cryptocurrency market. I was responsible for data collection, data cleaning, and building baseline models. In this post, I have explored our approach to problem formulation.
Introduction
Extracting insights from financial text data has attracted the attention of traders and investors in recent years. Researchers have been using machine learning models to analyze the massive amount of text generated every day to predict market behavior. Research in this area has been mostly done on sentiment analysis of social media data to determine whether people are talking about the market positively, negatively, or neutral. Different tools are available for this purpose. Tools like Santiment or Sennet AI let traders watch social media trends and people’s sentiment alongside other price chart indicators.

These tools miss an important point. Most of the time a rise or fall in market prices leads to social media posts and people’s reactions. It is rare to get insights about the market’s future trend from people’s emotions in their posts. To address this matter, technical analysis reports are used in this study. Technical analysts use price movements in price charts to analyze the future trends of the price. They study different indicators and patterns from the price chart and predict the future behavior of the market. Technical analysis reports are the outcome of technical analysts’ investigation of the price chart.
Technical analysis reports include information about the behavior of the price chart and how the behavior might affect the chart's future trend. These reports carry much more information about the market movements than social media posts. Therefore, it is more likely that technical reports are correlated with price movements because writers are usually traders with expertise in market analysis.
We have used technical analysis reports and derived insights into the cryptocurrency market behavior.
Sample posts
We have crawled posts from Tradingview to form our dataset. Tradingview is a platform and social network for traders and investors where they can use different charts and technical features to make trading decisions. Traders can also share their opinions and analysis of the market in a section called Ideas. We have collected posts from this section. Writers can choose between three options (i.e., Long, Short, and Education) to describe the general purpose of their post. We leveraged these labels to define a supervised classification problem.
In addition to assigning a label, market analysts can select other entities like timeframe for their decisions. Table 1 shows a sample post of our dataset.

In order to collect the posts from Tradingview, a crawler was developed. Then we deployed the crawler using Docker and Elasticsearch. The crawler was set to run once in a day and collect all the posts written about the 163 most popular cryptocurrency symbols. About 24,000 posts were collected and stored. Table 2 summarizes the statistics of our dataset.
Baseline methods and results
We used state-of-the-art models in NLP and finance on our dataset as baselines to see what performance can be achieved on our dataset.
First, We used the SBERT library to get document embeddings (Mini-LM model with 384-dimensional embedding output). Then we used an SVM model to classify the document embeddings. The results are presented in Table 3.

Second, We used the BERT base model and added a classification head. Then, we fine-tuned the model on our dataset.

Pegasus AI has trained a BERT model for sentiment analysis on financial news called FinBERT. We used the base of this model to extract the embeddings and then used an SVM model to classify the embeddings.
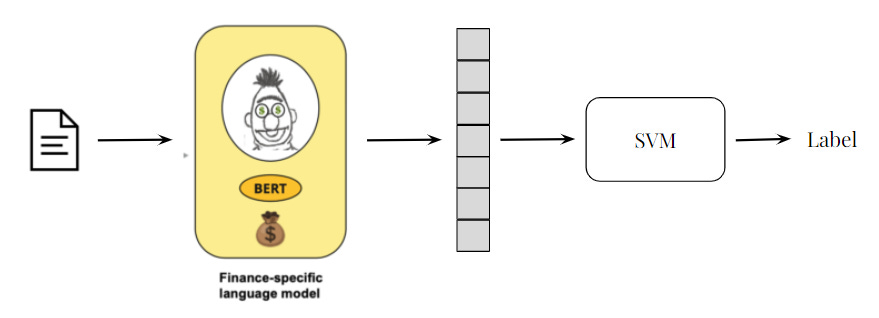
Table of results:

As shown in the table, the fine-tuned BERT model performs better than other baselines with an average F1 score of 0.76.
 | A guest post by
|